Wednesday, May 18, 2011

Using Nginx as a load balancer

Here’s a look at how nginx does basic load balancing :

upstream  yoursite  {    
server   yoursite1.yoursite.com;   
server   yoursite2.yoursite.com; 
} 
server 
{   
 server_name www.yoursite.com;    
 location / {      
             proxy_pass  http://yoursite;    
            }
 } 

This configuration will send 50% of the requests for www.yoursite.com to yoursite1.yoursite.com and the other 50% to yoursite2.yoursite.com.

ip_hash

You can specify the ip_hash directive that guarantees the client request will always be transferred to the same server.
If this server is considered inoperative, then the request of this client will be transferred to another server.

upstream  yoursite  {    
 ip_hash;    
 server   yoursite1.yoursite.com;    
 server   yoursite2.yoursite.com; 
} 

down

If one of the servers must be removed for some time, you must mark that server as down.

upstream  yoursite  {    
 ip_hash;   
 server   yoursite1.yoursite.com down;    
        server   yoursite2.yoursite.com;
} 

weight

If you add a weight tag onto the end of the server definition you can modify the percentages of the requests send to the servers.

When there’s no weight set, the weight is equal to one.

upstream  yoursite  {    
 server   yoursite1.yoursite.com weight=4;    
 server   yoursite2.yoursite.com; 
} 

This configuration will send 80% of the requests to yoursite1.yoursite.com and the other 20% to yoursite2.yoursite.com.

note: It’s not possible to combine ip_hash and weight directives.

max_fails and fail_timeout

max_fails is a directive defining the number of unsuccessful attempts in the time period defined by fail_timeout before the server is considered inoperative. If not set, the number of attempts is one. A value of 0 turns off this check.
If fail_timeout is not set the time is 10 seconds.

upstream  yoursite  {    
 server   yoursite1.yoursite.com;    
 server   yoursite2.yoursite.com max_fails=3  fail_timeout=30s; } 

In this configuration nginx will consider yoursite2.yoursite.com as inoperative if a request fails 3 times with a 30s timeout.

backup

If the non-backup servers are all down or busy, the server(s) with the backupdirective will be used.

upstream  yoursite  {    
 server   yoursite1.yoursite.com max_fails=3;    
 server   yoursite2.yoursite.com max_fails=3;    
 server   yoursite3.yoursite.com backup; 
} 

This configuration will send 50% of the requests for www.yoursite.com to yoursite1.yoursite.com and the other 50% to yoursite2.yoursite.com.
If yoursite1.yoursite.com and yoursite2.yoursite.com both fails 3 times the requests will be send to yoursite3.yoursite.com.


10 baby steps to install Memcached Server and access it with PHP

Thinking of implementing caching for your php application , you are at a right place. Just in 10 simple (copy and paste) steps you can install and access Memcached Server.
Step1: Install libevent ,libmemcached and libmemcached devel (dependency)
yum install libevent
yum install libmemcached libmemcached-devel

.

Step 2: Install Memcached Server1 yum install memcached

.
Step 3: Start Memcached server1 memcached -d -m 512 -l 127.0.0.1 -p 11211 -u nobody


(d = daemon, m = memory, u = user, l = IP to listen to, p = port)
.
Step 4: Check your memcached server is running successfully1 ps -eaf | grep memcached

.
Step 5: Connect Memcached server via telnet1 telnet 127.0.0.1 11211

.
Step 6: Check current status of Memcached Server on telnet prompt1 stats

.
Step 7: Exit telnet1 quit

.
Step 8: Install PHP client to access Memcached Server1 pecl install memcache


It will make “memcache.so”, you have to just put it on your /etc/php.ini file.
.
Step 9: Restart your apache server1 service httpd restart

.
Step 10: Open your favorite editor to type below code and execute it, it will cache your data into Memcached server and access it back for you

$memcache = new Memcache;
$memcache->connect('127.0.0.1', 11211) or die ("Could not connect"); //connect to memcached server
$mydata = "i want to cache this line"; //your cacheble data
$memcache->set('key', $mydata, false, 100); //add it to memcached server
$get_result = $memcache->get('key'); //retrieve your data
var_dump($get_result); //show it
?>

.

Hurray!! All done!
Enjoy Caching with Memcached.
Cheers!

Troubleshooting Response Time Problems – Why You Cannot Trust Your System Metrics

Production Monitoring is about ensuring the stability and health of our system, that also includes the application. A lot of times we encounter production systems that concentrate on System Monitoring, under the assumption that a stable system leads to stable and healthy applications. So let’s see what System Monitoring can tell us about our Application.

Let’s take a very simple two tier Web Application:

A simple two tier web application

This is a simple multi-tier eCommerce solution. Users are concerned about bad performance when they do a search. Let's see what we can find out about it if performance is not satisfactory. We start by looking at a couple of simple metrics.

CPU Utilization

The best known operating system metric is CPU utilization, but it is also the most misunderstood. This metric tells us how much time the CPU spent executing code in the last interval and how much more it could execute theoretically. Like all other utilization measures it tells us something about the capacity, but not about health, stability or even performance. Simply put: 99% CPU utilization can either be optimal or indicate impeding disaster depending on the application.

The CPU Usage of the two tiers

The CPU charts show no shortage on either tier

Let's look at our setup. We see that the CPU utilization is well below 100%, so we do have capacity left. But does that mean the machine or the application can be considered healthy? Let’s look at another measure that is better suited for the job, the Load Average (System\Processor QueueLength on Windows ). The Load Average tells us how many threads or processes are currently executed or waiting to get CPU time.

Unix Top Output: load average: 1.31, 1.13, 1.10

Linux systems display three sliding load averages for the last one, five and 15 minutes. The output above shows that in the last minute there were on average 1.3 processes that needed a CPU core at the same time.

If the Load Average is higher than the number of cores in the system we should either see near 100% CPU utilization, or the system has to wait for other resources and cannot max out the CPU. Examples would be Swapping or other I/O related tasks. So the Load Average tells us if we should trust the CPU usage on the one hand and if the machine is overloaded on the other. It does not tell us how well the application itself is performing, but whether the shortage of CPU might impact it negatively. If we do notice a problem we can identify the application that is causing the issue, but not why it is causing it.

In our case we see that neither the load average nor the CPU usage shines any light on our performance issue. If it were to show high CPU utilization or a high load average we could assume that the shortage in CPU is a problem, but we could not be certain.

Memory Usage

Used memory is monitored because the lack of memory will lead to system instability. An important fact to note is that Unix and Linux operating systems will most always show close to 100% memory utilization over time. They fill the memory up with buffers and caches which get discarded, as opposed to swapped out, if that memory is needed otherwise. In order to get the "real" memory usage we need subtract these. In Linux we can do by using the free command.

Memory Usage on the two systems

Memory Usage on the two systems, neither is suffering memory problems

If we do not have enough memory we can try to identify which application consumes the most by looking at the resident memory usage of a process. Once identified we will have to use other means to identify why the process uses up the memory and whether this is ok. When we look towards memory regarding Java/.NET performance we have to make sure that the application itself is never swapped out. This is especially important because Java accesses all its memory in a random-access fashion and if a portion were to be swapped out it would have serve performance penalties. We can monitor this via swapping measures on the process itself. So what we can learn here is whether the shortage of memory has a negative impact on application performance. As this is not the case, we are tempted to ignore memory as the issue.

We could look at other measures like network or disk, but in all cases the same thing would be true, the shortage of a resource might have impact, but we cannot say for sure. And if we don't find a shortage it does not necessarily mean that everything is fine.

Database

An especially good example of this problem is the database. Very often the database is considered the source of all performance problems, at least by the application people. From a DBA's and operations point of view the database is often running fine though. Their reasoning is simple enough, the database is not running out of any resources, there are no especially long running or CPU consuming statements or processes running and most statements execute quite fast. So the database can not be the problem.

Let's look at this from an application point of view

Looking At The Application

As users are reporting performance problems the first thing that we do is to look at the response time and its distribution within our system.

The overall distribution in our web application

The overall distribution in our system does not show any particular bottleneck

At first glance we don't see anything particularly interesting when looking at the whole system. As users are complaining about specific requests lets go ahead and look at these in particular:

Response time distribution of the search

The response time distribution of the specific request shows a bottleneck in the backend and a lot of database calls for each and every search request

We see that the majority of the response time lies in the backend and the database layer. That the database contributes a major portion to the response time does not mean however that the DBA was wrong. We see that every single search executes 416 statements on average! That means that every statement is executing in under one millisecond and this is fast enough from the database point of view. The problem really lies within the application and its usage of the database. Let's look at the backend next.

Heap usage and GC activity on the backend

The Heap Usage and GC activity chart shows a lot of GC runs, but does it have negative impact?

Looking at the JVM we immediately see that it does execute a lot of garbage collection (the red spikes), as you would probably see in every monitoring tool. Although this gives us a strong suspicion, we do not know how this is affecting our users. So let's look at that impact:

GC Runtime suspensions that have an impact on the search

These are the runtime suspensions that directly impact the search. It is considerable but still amounts to only 10% of the response time

A single transaction is hit by garbage collection several times and if we do the math we find out that garbage collection contributes 10% to the response time. While that is considerable it would not have made sense to spend a lot of time on tuning it just now. Even if we get it down to half it would only have saved us 5% of the response time. So while monitoring garbage collection is important, we should always analyze the impact before we jump to conclusions.

So let's take a deeper look at where that particular transaction is spending time on the backend. To do this we need to have application centric monitoring in place which we can then use to isolate the root cause.

Response time distribution of the search within the backend

The detailed response time distribution of the search within the backend shows two main problems: too many EJB calls and a very slow doPost method

With the right measure points within our application we immediately see the root causes of the response time problem. At first we see that the WebService call done by the search takes up a large portion of the response time. It is also the largest CPU hotspot within that call. So while the host is not suffering CPU problems, we are in fact consuming a lot of it in that particular transaction. Secondly we see that an awful lot of EJB calls are done which in turn leads to the many database calls that we have already noticed.

That means we have identified a small memory-related issue; although there are no memory problems noticeable if we were to look only at system monitoring. We also found that we have a CPU hotspot, but the machine itself does not have a CPU problem. And finally we found that the biggest issue is squarely within the application; too many database and EJB calls, which we cannot see on a system monitoring level at all.

Conclusion

System metrics do a very good job at describing the environment, after all that is what they are meant for. If the environment itself has resource shortages we can almost assume that this has a negative impact on the applications, but we cannot be sure. If there is no obvious shortage this does not, however, imply that the application is running smoothly. A healthy and stable environment does not guarantee a healthy, stable and performing application.

Similar to the system, the application needs to be monitored in detail and with application-specific metrics in order to ensure its health and stability. There is no universal rule as to what these metrics are, but they should enable us to describe the health, stability and performance of the application itself.

Nginx and Memcached, a 400% boost!

If web architectures, performance, or scalability are topics you would like to keep on top of (who doesn't!), then chances are, you've heard of Nginx("engine x"). Originally developed by Igor Sysoev for rambler.ru (second largest Russian web-site), it is a high-performance HTTP server / reverse proxy known for its stability, performance, and ease of use. The great track record, a lot of great modules, and an active development community have rightfully earned it a steady uptick of users, and most recently, a notable mention in the Netcraft report.
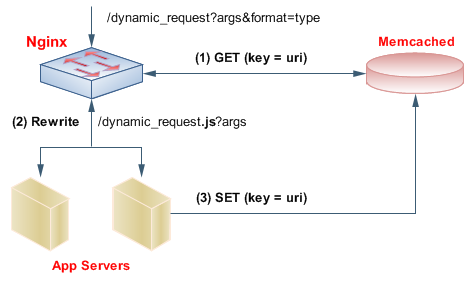
Memcached module - an easy 4x speed multiplier

Memcached, the darling of every web-developer, is capable of turning almost any application into a speed-demon. Benchmarking one of my own Rails applications resulted in ~850 req/s on commodity, non-optimized hardware - more than enough in the case of this application. However, what if we took Mongrel out of the equation? Nginx, by default, comes prepackaged with the Memcached module, which allows us to bypass the Mongrel servers and talk to Memcached directly. Same hardware, and a quick test later: ~3,550 req/s, or almost a 400% improvement! Not bad for a five minute tweak!

Nginx+ Memcached

Think smart, forget cache invalidations

The only snag in our scheme for easy performance gains comes with the fact that more often than not, our application servers contain additional caching policies (read invalidations / authentication), and MIME type logic. The former, as recently documented by Tobias Lütke and Geoffrey Grosenbach, if properly thought through can be solved with some clever URL rewriting policies and automatic TTL timeouts. When implemented correctly, we could simply set the memcached key to be the full request URL, allowing us to completely bypass our app. servers.

MIME-type logic

MIME type magic can be as easy as complex as we wish. If you only serve one content type ('text/html', for example), the solution is simple:

location /dynamic_request {    # Set default type to text/html    default_type  text/html;      # ... }  

Dynamic argument types, just for fun

However, if we want to serve multiple content-types, or perhaps even parameterize the request type in a query string, we've got some extra work to do. Not unlike any other HTTP server, Nginx checks the filetype extension at the end of every request path to determine the correct content-type header, a solution which unfortunately breaks down in majority of modern, URL friendly web-applications:

1. GET /dynamic_request.js - Content-Type = text/javascript
2. GET /dynamic_request - Content-Type = ?
3. GET /dynamic_request?format=js - Content-Type = ?

Case 1 is easily solved by Nginx directly. Case 2 is tricky, but can be solved via a 'default_type' line in the config as document above. And case 3 will require some additional logic - namely, we can hardcode a rule to rewrite our dynamic query string parameters to automagically add an extension to the path of each incoming request:

location /dynamic_request {     # append an extenstion for proper MIME type detection            if ($args ~* format=json) { rewrite ^/dynamic_request/?(.*)$ /dynamic_request.js$1 break; }            if ($args ~* format=xml)  { rewrite ^/dynamic_request/?(.*)$ /dynamic_request.xml$1 break; }              memcached_pass 127.0.0.1:11211;            error_page 404 = @dynamic_request; }  

That should do the trick! Cache invalidations are handled, MIME types are served correctly, and our app. servers are bypassed in 95%+ of the cases. Instead, Nginx talks directly to Memcached and only proxies the cache misses - an easy 400% performance boost!

What's Your Scalability Plan?

How do you plan to scale your system as you reach predictable milestones? This topic came up in another venue and it reminded me about a great comment an Anonymous wrote a while ago and I wanted to make sure that comment didn't get lost.

The Anonymous scaling plan was relatively simple and direct:My two cents on what I'm using to start a website from scratch using a single server for now. Later, I'll scale out horizontally when the need arises.

Phase 1

  • Single Server, Dual Quad-Core 2.66, 8gb RAM, 500gb Disk Raid 10
  • OS: Fedora 8. You could go with pretty much any Linux though. I like Fedora 8 best for servers.
  • Proxy Cache: Varnish - it is way faster than Squid per my own benchmarks. Squid chokes bigtime.
  • Web Server: Lighttpd - faster than Apache 2 and easier to configure for me.
  • Object Cache: Memcached. Very scalable.
  • PHP Cache: APC. Easy to configure and seems to work fine.
  • Language: PHP 5 - no bloated frameworks, waste of time for me. You spend too much time trying to figure out the framework instead of getting work done.
  • Database - MySQL 5. I didn't consider Postgres because I've never used it. There are just a lot more tools available for MySQL.

  • Phase 2
  • Max Ram out to 64 GB, cache everything

  • Phase 3
  • Buy load balancer + 2 more servers for front end Varnish/Memcached/Lighttpd.
  • Use original server as MySQL database server.

  • Phase 4

  • Depending on my load & usage patterns, scale out the database horizontally with an additional server. I don't expect the db to be a bottleneck for my website as only metadata info is stored there. I'll mostly be serving images stored on the file system. Possibly separate Varnish / Memcached / Lighttpd tier into separate tiers if necessary. But I'll carefully evaluate the situation at this point and scale out appropriately and use CDN for static content if necessary.

  • Phase 5
  • Max all servers to 64gb of RAM, cache, cache, cache.

  • Phase 6
  • If I get this far then I'm a multi-millionaire already so I'll replace all of the above machines with whatever the latest and greatest is at that time and keep scaling out.

    The important point is that I know how to scale each layer when/if the need arises. I'll scale the individual machines when necessary and scale horizontally too.In previous post we also read where ThemBid has a nice simple scalability plan too :
  • Use Munin to tell when to think about upgrading. When your growth trend will soon cross your resources trend, it's time to do something.
  • Move MySQL to a separate server. This frees up resources (CPU, disk, memory). What you want to run on this server depend on its capabilities. Maybe run a memcached server on it.
  • Move to a distributed memory cache using memcached.
  • Add a MySQL master/slave configuration.
  • If more webservers are needed us LVS on the front end as a load balancer.
  • Friday, April 29, 2011

    Linux Troubleshooting

    Linux is legendary for its stability - once set up correctly, a Linux box, left to its own devices, will run trouble-free for a very long time. Most problems arise soon after installation or major configuration changes, and are the result of misconfiguration, typographical errors or the occasional hardware failure.

    However, from time to time accidents do happen, even in the best-regulated environments . . .

    A Linux Troubleshooting Toolkit

    The best way to minimise the impact of those unforeseeable events is to prepate for them, by assembling the recovery tools in advance

    Tom's Root Boot Disk

    An essential part of every Linux professional's bag of tricks, this tiny (by today's standards) package unpacks to create a 1.722 MB floppy disk that is a complete Linux distribution with a selection of recovery tools - until you see how it's done you'll find it hard to believe a single floppy can contain so much!

    An alternative version comes in El Torito (bootable CD-ROM) format . You can download tomsrtbt from http://www.toms.net/rb/

    Knoppix

    This is a popular Linux distribution, based on Debian, which boots and runs entirely from CD-ROM. While it is popular for demonstrations, or for letting interested users get a taste of Linux without having to install a distribution on the hard drive, it is also incredibly useful as a system repair tool. You can download Knoppix fromhttp://www.knopper.net/knoppix/index-en.html (read the notes on software patents, then click on the KNOPPIX link - it's still there).

    mkbootdisk

    Most Linux distributions have a command to build a bootable floppy disk which can be used to repair a system. Red Hat Linux, for example, has the mkbootdiskcommand. In order to use this, you only need to know the desired kernel version to write to floppy, and you can find the current kernel version with the uname -rcommand:

    mkbootdisk 2.4.20-8

    or

    mkbootdisk `uname -r`

    In general, mkbootdisk and similar utilities will read various configuration files, such as /etc/fstab and /boot/grub/grub.conf, in order to work out the root filesystem, any required kernel command-line arguments and the drivers which will need to be loaded from the generated ramdisk image. One useful but not widely-known option for mkbootdisk is the --iso option, which makes a bootable CD-ROM image. This can then be updated with additional utilities, etc. if required.

    Other Boot Disks

    Most Linux distributions allow you to boot from the first installation CD in a system repair or 'rescue' mode. For Red Hat, for example, using the first CD-ROM to boot with the command 'linux rescue' will boot the system and then attempt a number of basic repairs automatically. The repair script will attempt to identify all the Linux partitions on your hard drives and mount them in the correct location. At the end of this process, you should wind up with the system completely assembled and mounted under /mnt/sysimage.

    Red Hat Linux Professional boxed sets of recent vintage also include a rather neat credit-card-sized rescue CD, and similar CD's are sometimes available from Linux-related company stands at trade shows.

    Problems:

    Can't Boot?

    Watch the system closely as it boots, and take note of any error messages that appear. If the system complains that it is unable to mount the root filesystem, for example, this can be for any of several reasons:

    • The BIOS cannot find the boot loader. This sometimes happens after you've installed Linux to dual-boot with Windows, but - out of concern to not misconfigure the system - have asked the install program to place the boot loader in the Linux root (or /boot) filesystem. The problem is that the BIOS can't see it there, unless you make that the active partition. The simplest fix is to reinstall Linux and this time, let it place the LILO or GRUB boot loader into the Master Boot Record - don't worry, the Linux boot loaders are automatically set up to let you choose Linux or Windows at boot time. It is possible to perform a more complex fix, for example by copying the Linux boot loader sector into a file, and setting up the Windows NT/2K/XP boot loader to chain to it - but that is too complex to describe here (seehttp://www.lesbell.com.au/Home.nsf/web/Using+the+NT+Boot+Loader+to+Boot+Linux?OpenDocument where you'll find a longer article describing how to use the NT boot loader to boot Linux).
    • The kernel doesn't have a device driver to access the hard drive (e.g. a SCSI drive). Fix this by using the mkinitrd script to build a new initrd file that contains the correct drivers, or recompile the kernel to include the driver code. This usually happens because you've built a new kernel and slightly messed up the configuration.
    • The kernel doesn't have a filesystem driver to access the root partition. For example, if the root filesystem is formatted with ext3, then you will need the ext3 andjbd modules in the initrd or compiled into the kernel. Fix as for the previous problem. Again, this usually happens after building a new kernel.
    • The partition table has been modified, for example, by the installation of another operating system. In this case, edit the kernel command line (in /ec/lilo.confor /boot/grub/menu.lst) and the contents of /etc/fstab to contain the correct entries.
    • Filesystems are corrupted, due to a power failure or system crash. Generally, after a system crash or power outage (what? No UPS?), the system will come up and repair itself. If you are using a journalling filesystem like ext3fs, jfs, xfs or resiserfs, it will usually perform a roll-forward recovery from its journal file and carry on. Even with the older ext2fs, the system usually runs an fsck (file system check) on the various file systems and repairs them automatically. However, just occasionally manual intervention is required - ; you might have to answer 'Y' to a string of questions (answering 'N' will get you nowhere unless you intend to perform really low-level repairs yourself in a last-ditch attempt to avoid data loss). In the worst case, you might have to reboot from rescue media and manuall run the e2fsck (or similar) command against each filesystem in turn. For example:

      e2fsck -p /dev/hda7

      If the program complains that the superblock - the master block that links to everything else - is corrupted, it is useful to remember that the superblock is so critical that it is duplicated every 8192 blocks through the filesystem and you can tell e2fsck to use one of the backups:

      e2fsck -b 8193 /dev/hda7

    • One or more filesystems cannot be found and mounted: Check the contents of /etc/fstab - in making quick alterations here, typographical errors are common. You can use the e2label command to view the label of each filesystem: some distributions set these to the mount point so you can figure out what is what.

    In each case, you will need to boot from some kind of rescue media, then work at the command line to repair the damage. If you boot from tomsrtbt or Knoppix, you will have editors and other utilities available. If you boot from the Red Hat installation CD in rescue mode, you will need to change the root directory so that the various system directories and filesystems are in the correct locations:

    chroot /mnt/sysimage

    See the box "The chroot Command" for details of why and how this works.

    Forgot root password

    If you have - really have - forgotten the root password for your system, it is still possible, in many cases, to log in and fix this. On some distributions, you can boot in single-user maintenance mode (runlevel 1) by appending a '1' or 'single' on the end of the normal kernel boot command line. With the LILO boot loader, for example, you can type

    linux 1

    to boot this way. With GRUB, it's a little more complex: you have to choose the boot menu item you want to use, then press 'e' to edit it, move to the kernel command line and press 'e' to edit it, append the '1' at the end of the line, press Enter to terminate editing and then press 'b' to boot it.

    However, some distributions will still request the root password in runlevel 1. For those, you should append the option 'init=/bin/bash' to the kernel command line, e.g.

    linux init=/bin/bash

    Now, instead of running the init process to kick off all the startup scripts, the kernel will simply run a bash shell. Since the startup scripts have not run, you may have to mount other filesystems manually, and you will certainly have to remount the root filesystem read-write with the command:

    mount -o remount,rw /

    Now, you can set about removing the root password. To do this, simply edit the /etc/shadow file and remove the encrypted password field from the file - it's usually the second field of the first line. You can now reboot, log in as root and use the passwd command to reset the password.

    Security Warning!

    Now that everyone knows this tip, you should take care to set a LILO or GRUB password to stop an attacker from editing the boot command line and breaking into your system this way. Of course, an attacker could also remove the root password by booting from floppy or CD, so you should set the system to boot from hard drive first, and then password-protect the BIOS settings, too!

    Can't Eject CD-ROM?

    You can normally eject a CD using the eject command (and you can close the drive again later with eject -t). But what if you get a message:

    eject: unable to eject, last error: Invalid argument

    The problem here is that something is accessing the CD-ROM drive - but what? You can use the fuser command to find out:

    fuser /dev/cdrom

    will show processes that have an open file or are otherwise accessing the CD-ROM drive. The command

    fuser -uik /dev/cdrom

    will show you the process ID and user that "owns" the drive, and will interactively allow you to kill the process.

    No sound

    Sound configuration is fairly tricky unless you know exactly what type of sound hardware you have - the chipset, not the brand of card. The simplest solution is to use the distribution's own sound configuration command - for Red Hat, this is redhat-config-soundcard or sndconfig (for the older versions).

    X resolution too low or too high

    Try using the left Ctrl and Alt keys with the + and - keys on the numeric pad to cycle through the various resolutions available on your system. You can also manually edit the XF86Config file (look in /etc/X11/ or nearby for this, depending on your distribution), then find the relevant Modes line, and comment out inappropriate modes

    For example, if my monitor couldn't cope with 1400 x 1050 resolution, I would remove that entry from the Modes line in my XF86Config file:

    Section "Screen"
    Identifier "Screen0"
    Device "Videocard0"
    Monitor "Monitor0"
    DefaultDepth 24
    SubSection "Display"
    Depth 24
    Modes "1400x1050" "1280x1024" "1280x960" "1024x768" "800x600" "640x480"
    EndSubSection
    EndSection

    Sometimes, increasing the DefaultDepth entry will reduce the maximum resolution to something that your monitor can cope with.

    Find the Right Driver Module

    You can make the system attempt to load every device driver module of any given type in turn by using the command

    modprobe -t type \*

    where type is the name of a directory under /lib/modules/kernelver/kernel. For example:

    modprobe -t net \*

    will attempt to load most network drivers, one after another.

    Trouble-shooting techniques

    Use pairs of similarly-configured systems

    Quick things to check:

    Is a filesystem full? This can show up in lots of different ways: being unable to save files, print jobs not spooling correctly (especially on Samba print/file servers), and so on. Use the df command to see available space:

    [root@freya home]# df -H
    Filesystem Size Used Avail Use% Mounted on
    /dev/Volume00/LogVol00 520MB 254MB 240MB 52% /
    /dev/hda3 128MB 2 1MB 101MB 17% /boot
    /dev/Volume00/LogVol03 2.2GB 134MB 1.9GB 7% /home
    /dev/Volume00/LogVol05 520MB 8.5MB 485MB 2% /opt
    none 264MB 0 264MB 0% /dev/shm
    /dev/Volume00/LogVol02 1.1GB 36MB 969MB 4% /tmp
    /dev/Volume00/LogVol01 4.3GB 3.0GB 1.1GB 75% /usr
    /dev/Volume00/LogVol06 1.1GB 101MB 903MB 11% /usr/local
    /dev/Volume00/LogVol04 3.2GB 2.3GB 756MB 75% /var
    /dev/hda1 16GB 13GB 2.8GB 83% /mnt/winc

    Remember that a filesystem can fill up either because almost all of its data blocks are used up (some are reserved for the root user, just to get out of trouble) or because all its i-nodes (there is one of these per file) are used up.

    If you need to make space by deleting some large files, use the command 'ls -lS' to get a directory listing that is sorted by file size. To scan an entire filesystem (e.g. /home or /var) for the largest files, use the command:

    du | sort -n

    The largest files will be at the end of the listing.

    Adding New Drives

    Sometimes the growth of a filesystem - particularly /home - means that it is necessary to find it a new home; in other words, add another physical disk and relocate the filesystem to its new home where there is room to grow.

    Here is the procedure for adding another drive, with a single partition which will become the new /home filesystem (I'm assuming fdisk has already been used to partition it):

    As root:

    # mkdir /mnt/newhome
    # mkfs -t ext2 /dev/hdb1
    # mount /dev/hdb1 /mnt/newhome
    # (cd /home && tar cf - .) | (cd /mnt/newhome && tar xpf -)

    then

    # cd /
    # mv /home /home.old
    # mkdir /home
    # umount /mnt/newhome
    # mount /dev/hdb1 /home

    Once the new /home directory tree has been checked out, you can then safely

    # cd /home.old
    # rm -rf *
    # cd ..
    # rmdir /home.old
    # rmdir /mnt/newhome

    to clean up.

    Network Problems

    Use the ifconfig command to check whether an interface has been configured and is up. For example:

    Long delays while starting daemons at boot time

    If the system seems to stop for 30 seconds or more while starting - particularly when starting network deamons like sendmail or NFS - then the problem is likely to be either DNS misconfiguration, a DNS outage, or no network connection at all. Check that /etc/resolv.conf contains the correct DNS addresses, check that/etc/hosts contains the correct IP address and names for this machine, and then check that the network interface is up.

    Troubleshooting Techniques and Skills

    The first rule is: Use the log files - they are the primary source of debugging information and clues. You can examine the main log file with the command:

    tail /var/log/messages

    and you can watch it continuously by running the command:

    tail -f /var/log/messages

    in a window while you work. For security and login-related problems, check the file /var/log/secure. There are other log files and directories that relate to different subsystems in /var/log, and you should never overlook them.

    If trying to resolve boot-time problems, use the command:

    dmesg | less

    to review the kernel ring buffer.

    The next rule is to compare similarly-configured systems, if you have them. Often, you can see obvious differences in the configuration files between a working system and the broken system.

    Next: if you are stumped, talk the problem over with a colleague or friend. They don't have to know the perfect solution - often, their suggestions can trigger a new line of thinking or remind you of something you have overlooked.

    If you don't have someone you can talk to, then use online resources. Get to know how to perform searches at http://www.google.com/linux , and how to search thecomp.os.linux and similar newsgroups at http://groups.google.com. On many occasions, I've turned up answers online after exhausting my own ideas.

    Problem Avoidance Techniques

    Keep a system change log. Whenever you make changes to the system, write them into the log. In general, if you never make changes to a system, it will just keep running - so that if the system breaks, the problem is usually related to recent changes.

    Before making changes to critical system configuration files, make a backup copy which you can restore if everything goes pear-shaped. For example:

    cp /etc/fstab /etc/fstab.good
    vi /etc/fstab

    There is no substitute for learning as much as possible about how the system works, and the role of the various configuration files in /etc, the daemon start/stop scripts in/etc/rc.d/init.d, how the init process works, and so on.

    And, of course, the most importand System Administration Rule of all: Never make changes after three p.m. on a Friday!

    The chroot Command

    The chroot command is extremely useful for both system security and for system repair. Its basic syntax is:

    chroot new-root-dir [command ...]

    and its purpose is to run the specified command with the root directory changed to new-root-dir. If no command is specified, the default behaiour is to run an interactive shell (usually a bash shell). For example, the command:

    chroot /var/ftp

    will run a command shell in /var/ftp. However, note that the behaviour is to change the root directory first, and then try to invoke the command or shell, so that there had better be a file /var/ftp/bin/bash (which there would be, on many systems). In addition, the command will usually need to be statically linked, as otherwise it would attempt to load libraries from /lib, which is now /var/ftp/lib.

    The chroot command is often used to start network daemons on servers - this is so that if an attacker manages to compromise the daemon, perhaps through a buffer overflow, he is unable to navigate around the entire system directory tree, but is instead constrained within a 'chroot jail'.

    A major use of the chroot command is to change the root directory of the system after booting from a repair floppy or CD. For example, if you boot a Red Hat installation CD with the command 'linux rescue', the root file system is actually a RAM disk, and the root filesystem on your hard drive is mounted as /mnt/sysimage. Commands you give will load programs from /bin and /sbin on the RAM disk, which is obviously limited. To get access to those directories on the hard drive, you will need to change your root directory with the command

    chroot /mnt/sysimage